Zero-configuration debugging in Php Storm on Mac
Problem Description
While trying to make the zero configuration debugging of Php in Php Storm to work, there was a problem with using the default Php CLI based installation on Mac. Php Storm does not support CLI based Php installation for zero configuration debugging. Additionally, I was having problems with building Php downloaded from the PHP.NET website.
Problem Source
The default installation of Php is CLI (Command Line Interface) based, while Php Storm requires a Php cgi based installation with X-debug.
Problem Solution
The solution to this problem is to install another version of Php which is cgi based. There are several ways of installing Php which is cgi based. Personally I was having trouble building Php from source code because of missing dependencies. One solution that I found to be painless and easiest on Mac is to install it via brew. This method is presented in this section.
Installing Brew
To install brew, follow the instructions here. The prerequisites for installing brew is to make sure that you have Xcode Command Line Tools. Installing Xcode Command Line Tools is easy once you have Xcode, just enter the following command in the Terminal application below:
|
1 |
xcode-select --install |
Installing Php with X-debug using Brew
In order to be able to debug Php, one needs to have an installation of Php with X-debug or some other debugger like Zend Debugger installed. This post uses the default installation provided in brew with X-debug. To install Php with X-debug using brew, enter the following command in the Terminal program below:
|
1 2 |
brew tap homebrew/php brew install php56-xdebug |
Note that the latest php version at the time of the writing was 5.6, this might differ for you. Use the brew search php command to find the version you want to install.
Php is installed in a special folder on your Mac. It can be found under:
|
1 |
cd /usr/local/Cellar |
Setting up Php Storm for Zero-configuration debugging
Zero-configuration Php debugging setup can be done using the following steps:
- The first step is to add the newly installed Php from brew as an interpreter in Php Storm. To do this, go to PhpStorm-Settings-Languages & Frameworks-PHP.
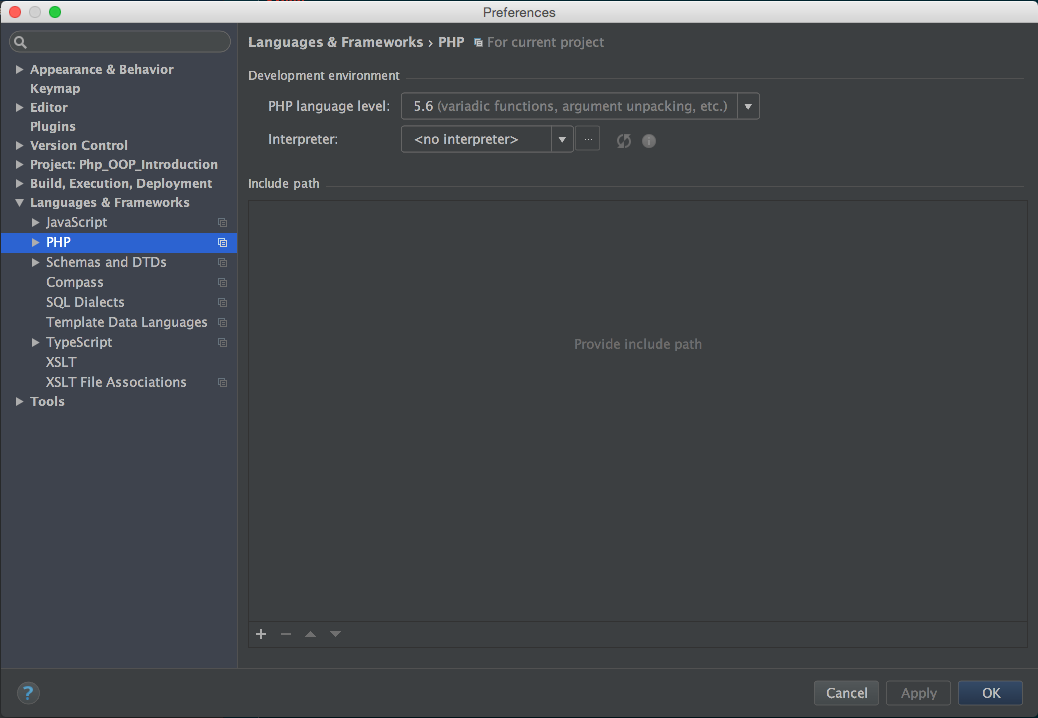
Finding the Interpreter Setting under Php Storm Settings. - Click on the
 icon and then use the + icon to add a new interpreter.
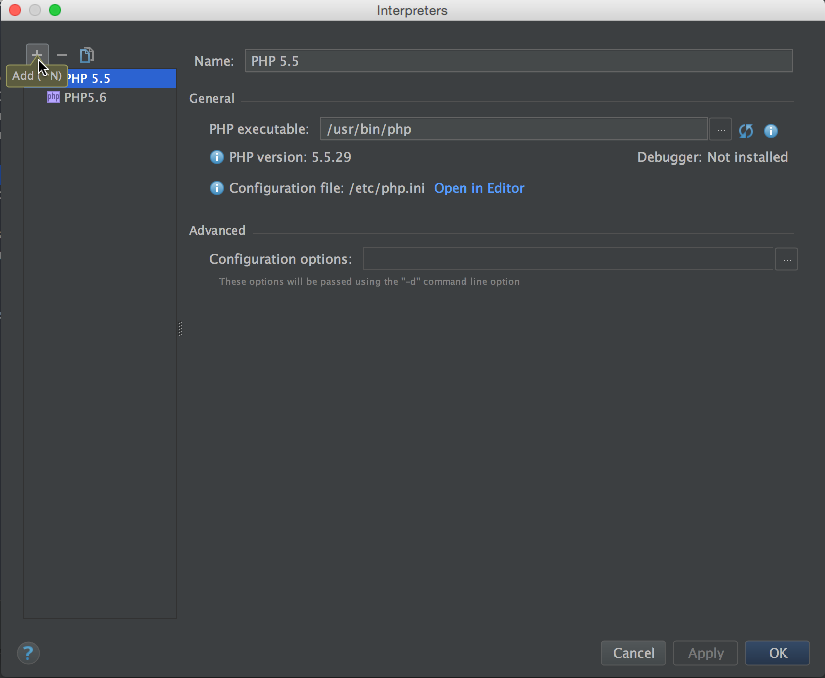
Click on the + icon to add a new Interpreter in the Add Interpreter Dialog - In order to install the interpreter, fill in the information as provided in the picture below:
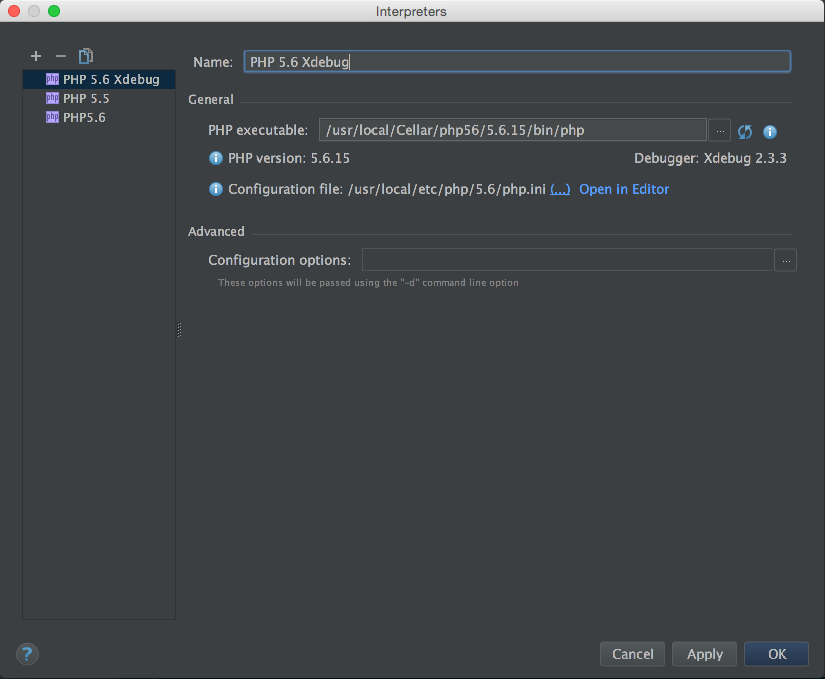
Instructions for Installing a new Php Interpreter. - Click on Open in Editor, this will open the php.ini file in Php Storm. Add the following at the end of the ini file. Save the file, close it, click on Apply and then click OK to close the settings dialog.
12345[XDebug]xdebug.remote_host = 127.0.0.1xdebug.idekey=PHPSTORMxdebug.remote_port = 9000xdebug.remote_enable = 1
- The next step is to install the X-debug Toggler extension for Safari. Follow the instructions here to install it. You can read about what this extension does and why we need it, on the installation website.
- Once X-debug Toggler extension is installed we need to go to Safari-Preferences-Extensions-Xdebug Toggler. Then fill in PHPSTORM in the IDE Key text box. Close the Safari Preferences dialog.
- Click on the bug icon next to address field in Safari so that it shows 1 on the icon
 . This means that Safari is ready to communicate with Php Storm.
 - Now we go back to Php Storm, create a file in the project and go to Run-Start Listening for PHP Debug Connections.
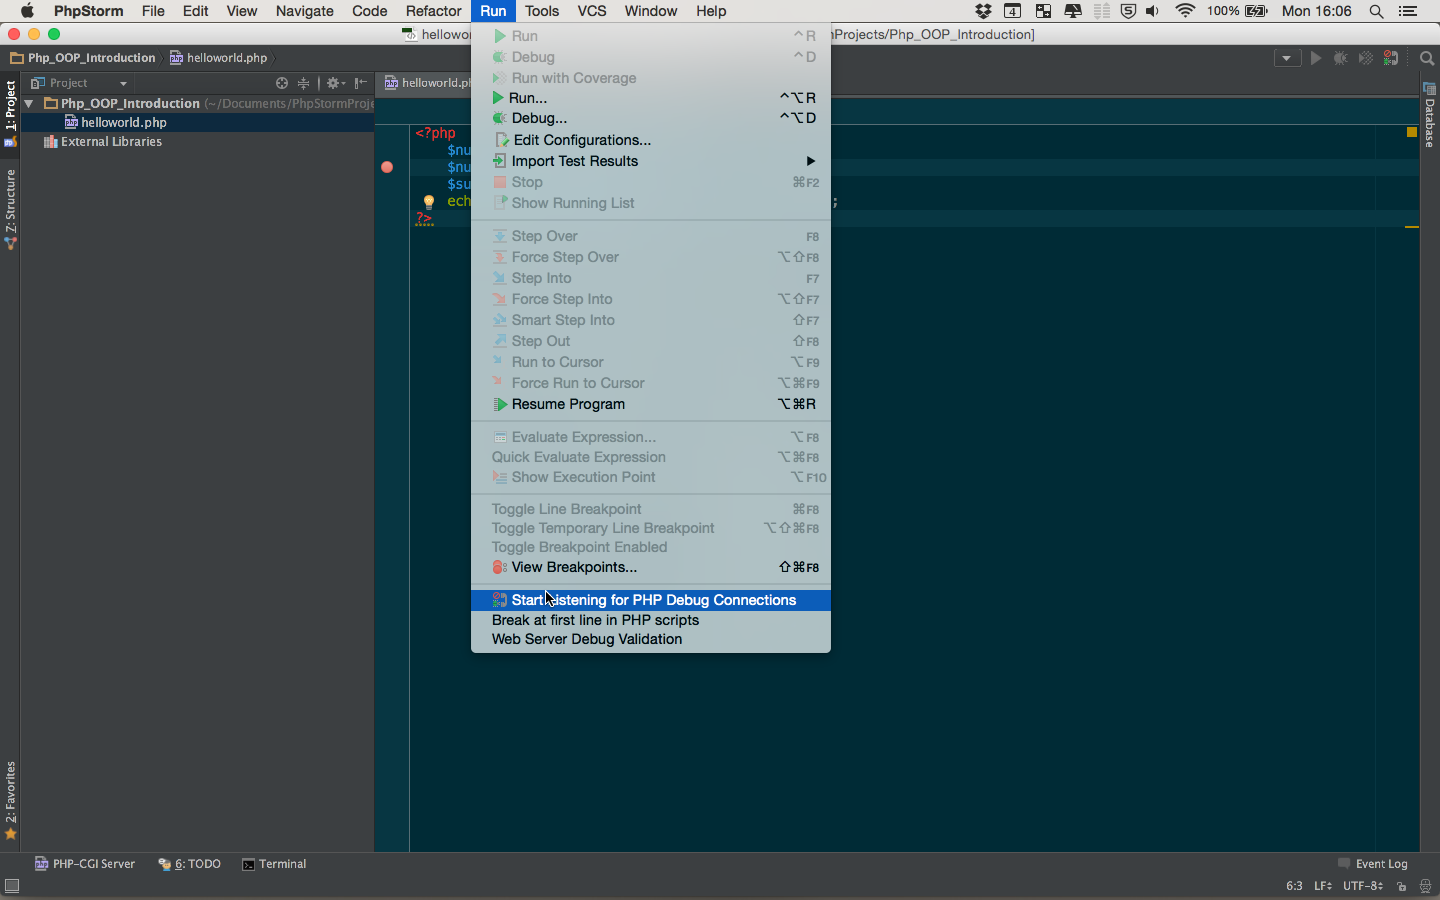
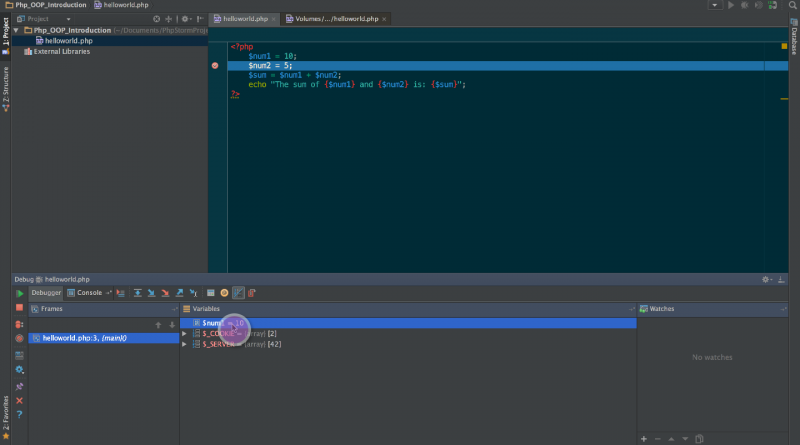
Click on Start Listening for Debug Connections under Run menu. - Set a breakpoint at an appropriate line in the php file and then go to View-Open in Browser-Safari. You should be switched to Safari and then back again in Php Storm with a dialog box open. This shows that the connection is working properly. If you are having troubles at this point, then review the steps above again or leave a comment below describing your problem so that the backyard-owner can help you out.
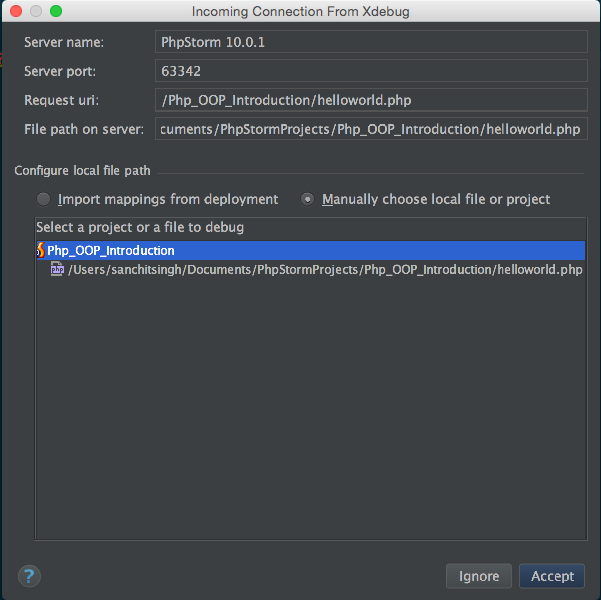
Xdebug Incoming Connection dialog box in Php Storm Note: Click on the helloworld.php file or the file that you launched in Safari instead of the project name for the debugging to work out of the box!
- Click on Accept to launch the debugger and enjoy debugging your Php program!